• 15 May
    FDF and Incpen publish sustainability checklist for packaging 

    FDF and Incpen publish sustainability checklist for packaging 

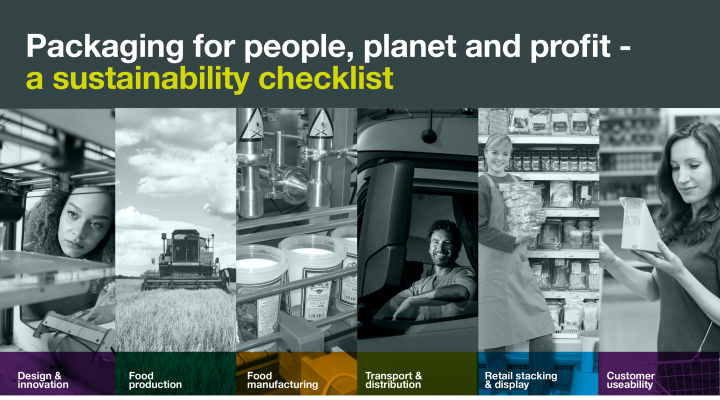
    The UK Food and Drink Federation (FDF) and the UK Industry Council for research on Packaging and the Environment (INCPEN) have recently published Packaging for people, planet and profit – a sustainability checklist.

    With a foreword from the UK Environment Minister Thérèse Coffey, the checklist will help companies in the fruit juice industry choose and optimise their packaging systems in order to continuously improve the sustainability of their value chain. It provides practical guidance for companies to improve resource efficiency at all stages of a packaged product’s journey while ensuring that the essential functionality of the packaging is not compromised. While including references to relevant regulation and guidance, the checklist also encourages companies to go above and beyond legal requirements.

    “We have made great progress in boosting recycling rates and making more packaging recyclable, and we continue to see exciting innovation in this area. But there is still much more to be done to increase sustainability across the supply chain – from producers and into the home.” Says Thérèse Coffey. “That’s why it is so encouraging to see food and drink manufacturers, packaging companies and retailers working together on the Wrap Framework for Greater Consistency in Household Recycling, sharing a vision to make recycling at home significantly easier for the wider public.”

    It will support businesses in considering packaging as part of the total product system for delivering products from point of production to point of consumption. This in turn will help strike the optimal balance between the often competing demands of designing packaging for optimum functionality, reuse and recovery considerations, and reduced transport impacts.

    The checklist also represents the first deliverable under FDF’s Ambition 2025 - to minimise the impact of used packaging associated with food and drink products and to encourage innovation in packaging technology and design that contributes to overall product sustainability.

    “This guidance will help businesses choose and optimise their use of packaging in ways that will contribute to a net improvement in the use of resources across the value chain” Says Helen Munday, Director of Food Safety, Science and Sustainability and Chief Scientific Officer, Food and Drink Federation. “This improvement can be achieved whilst continuing to ensure that food safety and quality requirements are not compromised. We encourage all food and drink operators to use it.”

    The checklist looks in detail at the functionality of packaging, re-use, recovery and recycling and transport including design and innovation, manufacturing, distribution, retail stacking and display and customer usability.

    Jane Bickerstaffe, Director of INCPEN, sums up saying: “The checklist will help companies improve packaging for food and drink and other products, make it more consumer-friendly and make supply chains more resource-efficient. Supply chain companies are more aware of, and responsive to, environmental concerns than many businesses. This checklist will help them demonstrate that responsiveness to the public.”

    To download the checklist go online to https://www.fdf.org.uk/packaging-checklist.aspx

    By Caroline Calder Features
  • 15 May
    Italian processed tomato overview

    Italian processed tomato overview

    Information from USDA, with updated trade data from Fruit Juice Focus 

    Italy is a world leading processed tomato producer, representing approximately 13% of the global production and 48% of Europe’s production, with a sector turnover of more than EUR3.2 billion.

    Acreage to processed tomatoes amounts to nearly 68 640 hectares split mainly among the central-southern provinces of Foggia, Caserta, and Potenza, and the northern districts of Parma, Ferrara, and Piacenza. According to data released by the National Association of the Canned Vegetables Industry (Anicav),

    Italy’s processed tomato production totalled 5.1 million tonnes in 2016, a 5.5% decrease from the previous year, mainly due to adverse weather in central-southern provinces during summer. Processed tomato production reached 2.8 million tonnes in northern Italy (+6% over 2015) and 2.3 million tonnes in the centre-south (-13% over 2015).

    Crop environment 

    Generally, conditions in Italy allow for production of tomatoes throughout the year, although the bulk of the processing takes place between the months of July and December. Growing conditions vary substantially between the different regions. In the South, water is plentiful but expensive to use. Many farms utilize drip systems or sprinklers. Growers have set up cooperatives, which are part of larger producer organizations, whose main task is to make joint offers, sign contracts with processing firms, supply seeds, fertilizers and other treatments and own harvesters. Production in the North is completely mechanized and hybrids are predominantly used. The majority of the plantings are plug-seeding transplants. Direct seeding is rare and only used for the cultivation of paste tomatoes, which are sown with precision machines using coated seeds. For peeling tomatoes, the acreage is planted with plug seedlings. Tomatoes for paste are all machine harvested, but those for the production of canned tomatoes are mostly harvested manually.

    Varieties  

    The Italian tomato processing industry produces passata, sauces and pastes and is entirely separate from the fresh-market industry. Specific characteristics differentiate the two types of tomatoes: fresh market varieties are juicier and harvested prior to being ripe, while processing varieties contain higher percentages of solids, are vine ripened and typically have a thicker skin.

    Raw material base price Processed tomatoes are mainly produced on a contractual basis, with individual agreements between farmers and the industry.

    Last year the Italian tomato processors and producers organisations (POs) representing growers in northern Italy (mainly from Lombardy and Emilia Romagna) set the raw material base price at EUR85.20/tonne. AT the same time the POs representing growers in southern Italy (Calabria, Campania, Puglia, and Molise) set the raw material base price at EUR87.00/tonne for round tomatoes and EUR97.00/tonne for the long variety.

    Tomatoes

    By Caroline Calder Trade Data
  • 15 May
    Round-up: Citrus processing reports

    Round-up: Citrus processing reports

    Fundecitrus forecast on Brazil’s 2017/18 crop

    The 2017/18 orange production forecast for Brazil’s São Paulo and west-southwest Minas Gerais citrus belt is 364.47 million boxes (40.8 kg), says a new report by Fundecitrus (including cooperation of Markestrat, FEA-RP/USP and FCAV/Unesp1).

    Of this figure, 265 million boxes, or 73% of the projected crop, will come from the initial bloom, which should lead to healthy juice yields.

    Bearing trees total 174.78 million and the average number of fruit per tree in as of April 2017, not considering the droppage to occur during the season, was measured at 753 fruits per tree.

    The average number of fruit per tree may vary by 14 fruit more or less, which corresponds to 1.9% of the average number of fruit per tree obtained upon stripping.

    Fruit droppage 

    The average droppage rate is estimated at 18.5%. The forecast rate is greater than those assessed in the previous seasons and is related to a greater production volume expected for this season, which might cause an extended harvesting period, thus increasing fruit exposure to pests and diseases with potential to cause fruit droppage.

    Fruit size 

    The average size is estimated at 265 fruits per box of 40.8 kg. Smaller fruit are expected for this season due to the greater quantity of oranges on the trees which limit their growth potential. In addition, according to Somar Meteorologia, the expectation for the second half of 2017 is for a milder El Niño.

    USDA forecast on Florida’s 2016/17 crop

    The USDA’s May forecast on Florida’s current crop is up 1.00 million boxes to
    68.0 million boxes. The total includes 33.0 million boxes of the non-Valencia oranges (early, midseason, and Navel varieties) and 35.0 million boxes of Valencia oranges.

    The projection for frozen concentrated orange juice (FCOJ) yields is lowered to 1.41 gallons per box (42 brix).

    By Caroline Calder Trade Data Uncategorised
  • 15 May
    Juice trade in Africa

    Juice trade in Africa

    Taking the two most traded juices on the market: frozen concentrated orange juice concentrate (FCOJ) and apple juice concentrate (AJC), Fruit Juice Focus analyses imports and exports in Africa over the past decade. 

    FCOJ imports 

    Uptake of FCOJ in Africa has seen some fluctuation over the past few years. Imports spiked at 78 186 tonnes in 2012, primarily due to a surge in imports to Nigeria (not shown on table) which saw shipments increase ten-fold on the previous year to over 17 000 tonnes. Overall though, the region’s FCOJ imports have been fairly stable since 2007, ranging between 40 000-50 000 tonnes per year.

    FCOJ exports 

    While there has been a decline in FCOJ exports in the last couple of years, African shipments have shown significant growth over the past decade. Exports reached 74 613 tonnes in 2014, helped by a notable increase from Egypt, which sold 26 095 tonnes to foreign markets – more than double the volume from the previous year.

    AJC imports

    Africa has more than doubled its imports of AJC over the past decade. Again there was a notable spike in imports to Nigeria in 2012, which pushed total African uptake that year to 77 697 tonnes. South Africa is the largest importer of AJC in Africa, but in both 2006 and 2008, the country was a net exporter of the product.

    AJC exports 

    Apple concentrate exports out of Africa are fairly minimal. Countries such as South Africa produce good volumes, but also consume a lot. Exports reached a peak of 33 929 tonnes in 2012 – twice the level from the previous year. This increase is attributed to very high shipments from Swaziland (not shown on table) which sold 16 602 tonnes.

    Africa trade data tables 1 and 2


    Africa trade data tables 3 and 4

    By Caroline Calder Trade Data
1 16 17 18 19 20 21 22 33