Trade Data

  • 17 Jul
    ROUND-UP

    ROUND-UP

    Forecast on Brazil’s 2017/18 crop (USDA)

    The commercial area of the state of Sao Paulo and the western part of Minas Gerais should produce 364.5 million boxes, up 49% from the previous crop (245.3 million boxes). This projection is based on the Defence Fund for Citriculture’s (Fundecitrus) first citrus crop forecast, released on 10 May 2017.

    Total Brazilian FCOJ (65 brix equivalent) production for 2017/18 is forecast at 1.257 million tonnes, up 447 000 tonnes compared with 2016/17, due to higher expected fruit availability for crushing. The Sao Paulo industry is expected to process 320 million boxes for juice production (255 million boxes for FCOJ and 65 million boxes for NFC OJ). This would result in 1.172 million tonnes of juice (920 000 tonnes of FCOJ and 252 000 tonnes of NFC OJ). Other producing states should deliver 20 million boxes for processing.

    Total Brazilian FCOJ exports for 2017/18 are forecast at 1.143 million tonnes, up 248 000 tonnes from 2016/17 (895 000 tonnes), due to the expected higher volumes available. The Sao Paulo industry should contribute 840 000 tonnes of FCOJ. These figures include NFC OJ production converted to FCOJ (65 brix equivalent).

    The USDA forecasts ending stocks for 2017/18 at 100 000 tonnes (65 brix) up 74 000 tonnes from 2016/17. The USDA figures only include stocks in Brazil. CitrusBR forecasts stocks at 200 000-300 000 tonnes on 30 June 2018. CitrusBR global inventories include orange juice in storage tanks at processing plants and port terminals in Brazil and stocks abroad (vessels and port facilities worldwide).

    Brazil – Orange juice (65 brix) – Production, supply and demand  

    Tonnes 2015/16 2016/17 2017/18
    Delivered to processors 11506000 9058000 13872000
    Beginning stocks 329000 147000 24000
    Production 1006000 810000 1257000
    Exports 1153000 895000 1143000
    Domestic consumption 35000 38000 38000
    Ending stocks 147000 24000 100000

     Orange juice update – EU-28 (USDA)

    Orange juice production in 2016/17 is forecast at 101 941 tonnes (65 brix). Orange juice consumption is forecast to be stable at 826 941 tonnes.

    EU-28 is a net importer of orange juice, heavily dependent on third countries to reach the EU-28 orange juice demand. Brazil continues to be the main supplier of orange juice to the EU with around 90% of total imports. In 2015/16 the EU-28 imported 777 825 tonnes of orange juice.

    European Union – Orange juice (65 brix) – Production, supply and demand 

    Tonnes 2014/15 2015/16 2016/17
    Delivered to processors 1251000 1286000 1315000
    Beginning stocks 15000 15000 15000
    Production 96980 99963 101941
    Exports 49870 52049 50000
    Domestic consumption 936771 825468 826941
    Ending stocks 15000 15000 15000

    Argentina – Lemon (USDA)

    Lemon production for 2016/17 is expected to decrease to 1.27 million tonnes from 1.35 million tonnes the year before, due to a late frost, high temperatures and excess rain.

    Fresh lemon production in 2015/16 was also negatively impacted by rains towards the end of summer, which delayed the harvest about a month.

    Fresh lemon for processing in 2016/17 is estimated at 980 000 tonnes against 1.003 million tonnes the year before.

    Following the practice carried out in the past few years, relatively high volumes of fruit are being devoted for processing as a result of the decision made by the industry to export only fresh lemons meeting higher quality standards, thus restricting the export supply and preventing a steep decrease of international prices. This market strategy is working very well and is expected to continue.

    South Africa – Orange juice (USDA)

    The USDA estimates that production of orange juice in South Africa will increase by 18% to 22 717 tonnes in 2016/17, from 19 317 tonnes in 2015/16.

    Domestic consumption is expected to increase by 3% to 6 200 tonnes in 2016/17. The relatively high food price inflation has resulted in restricted growth in the domestic consumption of fresh fruit juices, especially in 100% fruit juice, and a shift in demand to orange juice from concentrates.

    Exports of orange juice in 2016/17 are predicted to decrease by 39% to 21 160 tonnes from 34 742 tonnes the year before. This is attributed to the available production, lower opening stocks, lower year-to-date exports up to April 2017 and USDA estimates for the remainder of the season.

    Producers in South Africa prefer to export fresh oranges rather than to sell to processors as export prices are eight times higher than prices achieved from processors. Netherlands, Botswana, Mozambique, Mauritius, Zambia and Zimbabwe, are the biggest markets for South African orange juice exports.

    South Africa – Orange juice (65 brix) – Production, supply and demand 

    Tonnes 2014/15 2015/16 2016/17
    Delivered to processors 403000 142000 167000
    Beginning stocks 25086 29003 8679
    Production 54821 19317 22717
    Exports 4548 34742 21160
    Domestic consumption 6800 6000 6200
    Ending stocks 29003 8679 12636

    New Zealand – Apple and pears (USDA)

    Processing volumes of apples in New Zealand for 2016/17 are forecast at 123 000 tonnes, a 12.8% reduction over 2015/16. This is a 14% revision down from the USDA’s initial forecast due to a higher percentage of the crop expected to make export grade.

    Apple processing volumes are estimated at 141 087 MT for 2015/16, 12.4% below 2014/15.

    The volume of pears going to the processing sector is estimated at 2 000 tonnes for 2016/17 – 200 tonnes higher than in 2015/16.

    By Caroline Calder Trade Data
  • 17 Jul
    AIJN juice report 2017 highlights

    AIJN juice report 2017 highlights

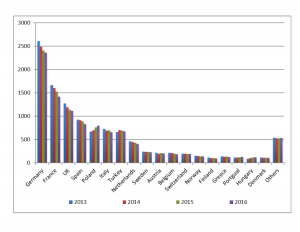
    Apart from in a handful of countries, European fruit juice and nectar (FJN) consumption is showing a decline over the period 2013 to 2016. The most notable country to have bucked the trend is Poland with a steady rise year on year during the period up 19% 2016 against 2013. Hungary (35%), Czech Republic (21%) and Slovakia (26%) are also showing notable increases for this period but from a much lower base.

    Of the top four countries by consumption in 2016 – all are down by more than 10% against 2013: Germany (-10%); France (-15%); UK (-12%) and Spain (-10%).

    When looking at trends by type of juice consumed, all are showing a decline with the exception of not from concentrate: 5.4% up for 2016 against 2015 and 14% up 2016 against 2012. Nectars are down 3.8% down 2016 against 2015 and 9% down 2016 against 2012 with juice from concentrate down 4.9% and 20% respectively for the same period.

    Globally, North America is still the biggest consumer both by per capita consumption (24.8 litres per person in 2016) and by volume consumption (8,943 million litres in 2016). Interestingly in the EU both Malta (population 0.4 million) and Germany (population 82.6 million) consumed more per capita in 2016 than North America at 31.0 and 28.6 litres per person.

    For a more detailed analysis of fruit juice consumption (orange, apple and pineapple) by country in Eastern Europe please click here.

    Definitions 

    Fruit juice and Nectars 

    Juice: 100% pure fruit juice or vegetable juice with no added ingredients, except permitted minerals and vitamins for the purpose of fortification and permitted additives. Includes products: from concentrate, not from concentrate, chilled, ambient, frozen concentrated juice, smoothies. Excludes carbonated juice.

    Nectars: 25-99% juice content

    Diluted fruit/vegetable juice and pulp, to which sweetening agents (e.g. sugar, honey, syrups and/or sweeteners) need to be added for the purposes of production. Permitted minerals and vitamins for the purpose of fortification and permitted additives may be added. Whilst juice content is required to be equal to or in excess of 25% by volume, minimum juice content varies according to the fruit in question. Includes products: from concentrate, not from concentrate, chilled, ambient and smoothies.

    Total fruit juices and nectars in EU (Million litres)

    2012 2013 2014 2015 2016 Difference 2016 Vs 2015
    Total 10357 9916 9589 9529 9299 -2.4%
    Total nectars 3609 3473 3415 3420 3291 -3.8%
    Total fruit juice 6748 6442 6175 6109 6008 -1.6%
    Total fruit juice from concentrate 4945 4593 4311 4163 3958 -4.9%
    Total fruit juice not from concentrate 1803 1849 1864 1946 2050 5.4%

    Largest EU FJN markets by volume consumption 2016

    Country Million litres
    Germany 2361
    France 1415
    UK 1116
    Spain 831
    Poland 800
    Others 2776
    Total 9299


    Largest EU FJN markets by per capita consumption 2016

    Country Population (million) Litres per person
    Malta 0.4 31
    Germany 82.6 28.6
    Netherlands 17 23.8
    Cyprus 1.2 23.4
    Austria 8.7 22.9
    Sweden 10 22.5

    Largest FJN markets by volume consumption by region 2016

    Region Million litres
    North America 8943
    West Europe 8208
    Asia Pacific 7683
    East Europe 4250
    Africa & Middle East 3457
    Latin America 3422
    Total 35963
    EU 28 9299

    Largest FJN markets by per capita consumption by region 2016

    Country Population (million) Litres per person
    North America 360.3 24.8
    West Europe 420.5 19.5
    EU 28 512.4 18.2
    East Europe 393.5 10.8
    Latin America 585 5.8
    Africa & Middle East 952.2 3.6
    Asia Pacific 3697.5 2.1

    aijn graph


    Acknowledgment: This information is sourced from the European Fruit Juice Association (AIJN). The AIJN represents the industry from the fruit processors to the packers of the consumer products. AIJN’s foundation goes back to 1958. The AIJN office is situated in the heart of the Brussels European quarter. 

    By Caroline Calder Trade Data
  • 17 Jul
    Fruit Juice Consumption in Eastern Europe

    Fruit Juice Consumption in Eastern Europe

    Taking three of the most traded juices on the market (orange, apple and pineapple) in both the concentrate and not for concentrate sectors, Fruit Juice Focus analyses consumption in Eastern Europe over the past five years (2012 to 2016).

    FRUIT JUICE NOT FROM CONCENTRATE

    Imports into Eastern Europe (tonnes) 

    Importers 2012 2013 2014 2015 2016 % variance 2016 versus 2015
    Poland Orange Juice 5271 6991 13190 18447 20851 13%
    Apple Juice 9811 10043 11704 14349 12250 -15%
    Pineapple Juice 1074 890 942 1225 1341 9%
    Czech Republic Orange Juice 10194 11230 10679 12611 11886 -6%
    Apple Juice 9845 9467 8560 11940 10170 -15%
    Pineapple Juice 2462 1377 1098 915 774 -15%
    Hungary Orange Juice 4993 6992 10910 11621 10617 -9%
    Apple Juice 3900 4279 4198 5513 6957 26%
    Pineapple Juice 467 581 629 567 296 -48%
    Slovakia Orange Juice 7559 7572 7352 8878 8868 0%
    Apple Juice 4105 4026 4019 4749 5272 11%
    Pineapple Juice 880 1080 922 957 393 -59%
    Romania Orange Juice 4537 4872 3656 5064 7014 39%
    Apple Juice 2662 2775 2301 3010 3262 8%
    Pineapple Juice 218 127 162 289 166 -43%
    Lithuania Orange Juice 2322 2885 3337 3441 4297 25%
    Apple Juice 751 924 1018 953 1397 47%
    Pineapple Juice 294 263 202 229 251 10%
    Bulgaria Orange Juice 2053 2287 3327 2752 3886 41%
    Apple Juice 1255 1368 1328 1826 2155 18%
    Pineapple Juice 338 289 230 310 745 140%
    Estonia Orange Juice 1346 1878 2068 1892 1885 0%
    Apple Juice 559 797 833 650 743 14%
    Pineapple Juice 228 203 250 146 213 46%
    Latvia Orange Juice 1371 1511 1587 1609 1522 -5%
    Apple Juice 612 723 732 651 729 12%
    Pineapple Juice 78 42 98 126 73 -42%
    Ukraine Orange Juice 337 425 238 98 490 400%
    Apple Juice 1783 2574 2134 395 1471 272%
    Pineapple Juice 128 159 72 20 112 460%
    Total: all countries Orange Juice 39983 46643 56344 66413 71316 7%
    Apple Juice 35283 36976 36827 44036 44406 1%
    Pineapple Juice 6167 5011 4605 4784 4364 -9%
    Totals + 81433 88630 97776 115233 120086 4%

    + Total: all three juices across all countries. Source: Fruit Juice Focus analysis from Customs Data

    Poland tops the consumption tables across all juices with imports of orange juice into Poland showing steady growth year on year for the period with 2016 13% up on 2015. Up until 2015 apple juice consumption was also showing growth year on year until 2016 when there was a drop of 15%.

    The two other major consumers of not for concentrate juices in Eastern Europe – the Czech Republic and Hungary – have both shown consistent growth in consumption of orange and apple juice over the period 2012 to 2015. However, 2016 has seen a backward trend with orange juice down 6% and 9% against 2015 in the Czech Republic and Hungary respectively, and apple juice down 15% for the same period in the Czech Republic. Conversely apple juice maintained growth in Hungary with a 26% increase for the same period.

    Pineapple juice consumption across all countries reveals mixed trends and with the volumes comparatively low in comparison with apple and orange juice any changes in the data will show disproportionate peaks and troughs.

    Despite smaller volumes overall, the following countries have shown steady growth in orange and apple juice consumption respectively during the period with 2016 showing well against 2015:  Romania (+39%; +8%), Lithuania (+25%; +47%) and Bulgaria (+41%; +18%).

    The good news is that the Eastern European region in general has maintained a steady increase year on year for the top two juices with orange juice consumption in 2016 being 78% up on 2012 and apple juice consumption up 26% for the same period. Looking at the picture over the past five years for all three juices combined across the region there has been a steady increase each year with 2016 finishing 4% up on 2015 and 47% up on 2012.


    FRUIT JUICE CONCENTRATE

    Imports into Eastern Europe (tonnes)

    Importers 2012 2013 2014 2015 2016 % variance 2016 versus 2015
    Poland Orange Juice 28648 32775 34681 34319 32085 -7%
    Apple Juice 51838 92886 78439 73928 54498 -26%
    Pineapple Juice 1698 2149 2543 1827 1057 -42%
    Czech Republic Orange Juice 7301 6823 12622 11778 16027 36%
    Apple Juice 2637 3085 2152 3068 3514 15%
    Pineapple Juice 514 529 498 311 247 -21%
    Hungary Orange Juice 7679 10144 8957 9168 9050 -1%
    Apple Juice 1761 5245 2267 6148 6234 1%
    Pineapple Juice 1305 1883 1441 1467 1192 -19%
    Slovakia Orange Juice 3962 3247 2643 3183 3481 9%
    Apple Juice 771 626 670 644 1668 159%
    Pineapple Juice 465 531 533 546 443 -19%
    Romania Orange Juice 3104 2701 3499 3255 3516 8%
    Apple Juice 962 592 782 781 1143 46%
    Pineapple Juice 150 127 127 121 138 14%
    Lithuania Orange Juice 2116 1840 1621 1471 1314 -11%
    Apple Juice 1266 874 839 1082 1058 -2%
    Pineapple Juice 250 379 551 492 499 1%
    Bulgaria Orange Juice 3157 2850 2640 4285 3134 -27%
    Apple Juice 539 436 559 684 1065 56%
    Pineapple Juice 427 503 516 441 128 -71%
    Estonia Orange Juice 1177 1117 884 714 632 -11%
    Apple Juice 1184 1560 1204 1228 1283 4%
    Pineapple Juice 252 583 275 152 87 -43%
    Latvia Orange Juice 1319 1330 1442 1183 1403 19%
    Apple Juice 1121 1296 1188 1236 1246 1%
    Pineapple Juice 220 270 229 302 138 -54%
    Ukraine Orange Juice 8731 8432 6875 5141 n/a n/a
    Apple Juice 2375 1265 343 350 405 16%
    Pineapple Juice 1960 1818 1586 1139 611 -46%
    Total: all countries  Orange Juice * 58463 62827 68989 69356 70642 2%
    Apple Juice 64454 107865 88443 89149 72114 -19%
    Pineapple Juice 7241 8772 8299 6798 4540 -33%
    Totals * + 130158 179464 165731 165303 147296 -11%

    * Excludes Ukraine orange juice as no 2016 data available. Source: Fruit Juice Focus analysis from Customs Data

    + Total: all three juices across all countries

    Poland is way ahead on orange juice concentrate (FCOJ) and apple juice concentrate (AJC) consumption compared to the other countries in Eastern Europe. However, FCOJ peaked in 2014 and has declined since with 2016 7% down against 2015. AJC has declined even further having peaked in 2013 and now showing a 26% drop year on year 2016 to 2015.

    Of the top three consumers – Poland, the Czech Republic and Hungary – all are showing downward or flattened out trends in consumption across all juices with the exception of the Czech Republic where FCOJ is up 36% 2016 against 2015 and the highest it’s been in the five-year period and up 15% for AJC for the same period (albeit from a fairly low base).

    In Poland and Hungary, the only significant consumers of pineapple juice concentrate in the region, consumption levels have been falling slowly but surely year on year with Poland being significantly down  42% – 2016 against 2015. All other countries in the region (apart from the Ukraine) are reporting from a low base with regards pineapple concentrate and any changes in the data show disproportionate highs and lows. The general trend is down or static.

    Taking the Eastern European region as a whole for the period, AJC is 19% down 2016 against 2015 and 33% down on its 2013 peak in consumption. Pineapple juice concentrate is 33% down 2016 against 2015 and 48% down on its 2014 high point in consumption. FCOJ is holding its own year on year (the Ukraine has been excluded from these total figs due to lack of 2016 data).

    Looking at the picture over the past five years for all three concentrates combined across the region there has been a notable decline with 2016 finishing 11% down on 2015 and 18% down on the high point of 2013.

    By Caroline Calder Trade Data
  • 15 May
    Italian processed tomato overview

    Italian processed tomato overview

    Information from USDA, with updated trade data from Fruit Juice Focus 

    Italy is a world leading processed tomato producer, representing approximately 13% of the global production and 48% of Europe’s production, with a sector turnover of more than EUR3.2 billion.

    Acreage to processed tomatoes amounts to nearly 68 640 hectares split mainly among the central-southern provinces of Foggia, Caserta, and Potenza, and the northern districts of Parma, Ferrara, and Piacenza. According to data released by the National Association of the Canned Vegetables Industry (Anicav),

    Italy’s processed tomato production totalled 5.1 million tonnes in 2016, a 5.5% decrease from the previous year, mainly due to adverse weather in central-southern provinces during summer. Processed tomato production reached 2.8 million tonnes in northern Italy (+6% over 2015) and 2.3 million tonnes in the centre-south (-13% over 2015).

    Crop environment 

    Generally, conditions in Italy allow for production of tomatoes throughout the year, although the bulk of the processing takes place between the months of July and December. Growing conditions vary substantially between the different regions. In the South, water is plentiful but expensive to use. Many farms utilize drip systems or sprinklers. Growers have set up cooperatives, which are part of larger producer organizations, whose main task is to make joint offers, sign contracts with processing firms, supply seeds, fertilizers and other treatments and own harvesters. Production in the North is completely mechanized and hybrids are predominantly used. The majority of the plantings are plug-seeding transplants. Direct seeding is rare and only used for the cultivation of paste tomatoes, which are sown with precision machines using coated seeds. For peeling tomatoes, the acreage is planted with plug seedlings. Tomatoes for paste are all machine harvested, but those for the production of canned tomatoes are mostly harvested manually.

    Varieties  

    The Italian tomato processing industry produces passata, sauces and pastes and is entirely separate from the fresh-market industry. Specific characteristics differentiate the two types of tomatoes: fresh market varieties are juicier and harvested prior to being ripe, while processing varieties contain higher percentages of solids, are vine ripened and typically have a thicker skin.

    Raw material base price Processed tomatoes are mainly produced on a contractual basis, with individual agreements between farmers and the industry.

    Last year the Italian tomato processors and producers organisations (POs) representing growers in northern Italy (mainly from Lombardy and Emilia Romagna) set the raw material base price at EUR85.20/tonne. AT the same time the POs representing growers in southern Italy (Calabria, Campania, Puglia, and Molise) set the raw material base price at EUR87.00/tonne for round tomatoes and EUR97.00/tonne for the long variety.

    Tomatoes

    By Caroline Calder Trade Data
1 2 3 4 5 6